Forest Interface Management

Protect forests from encroachment

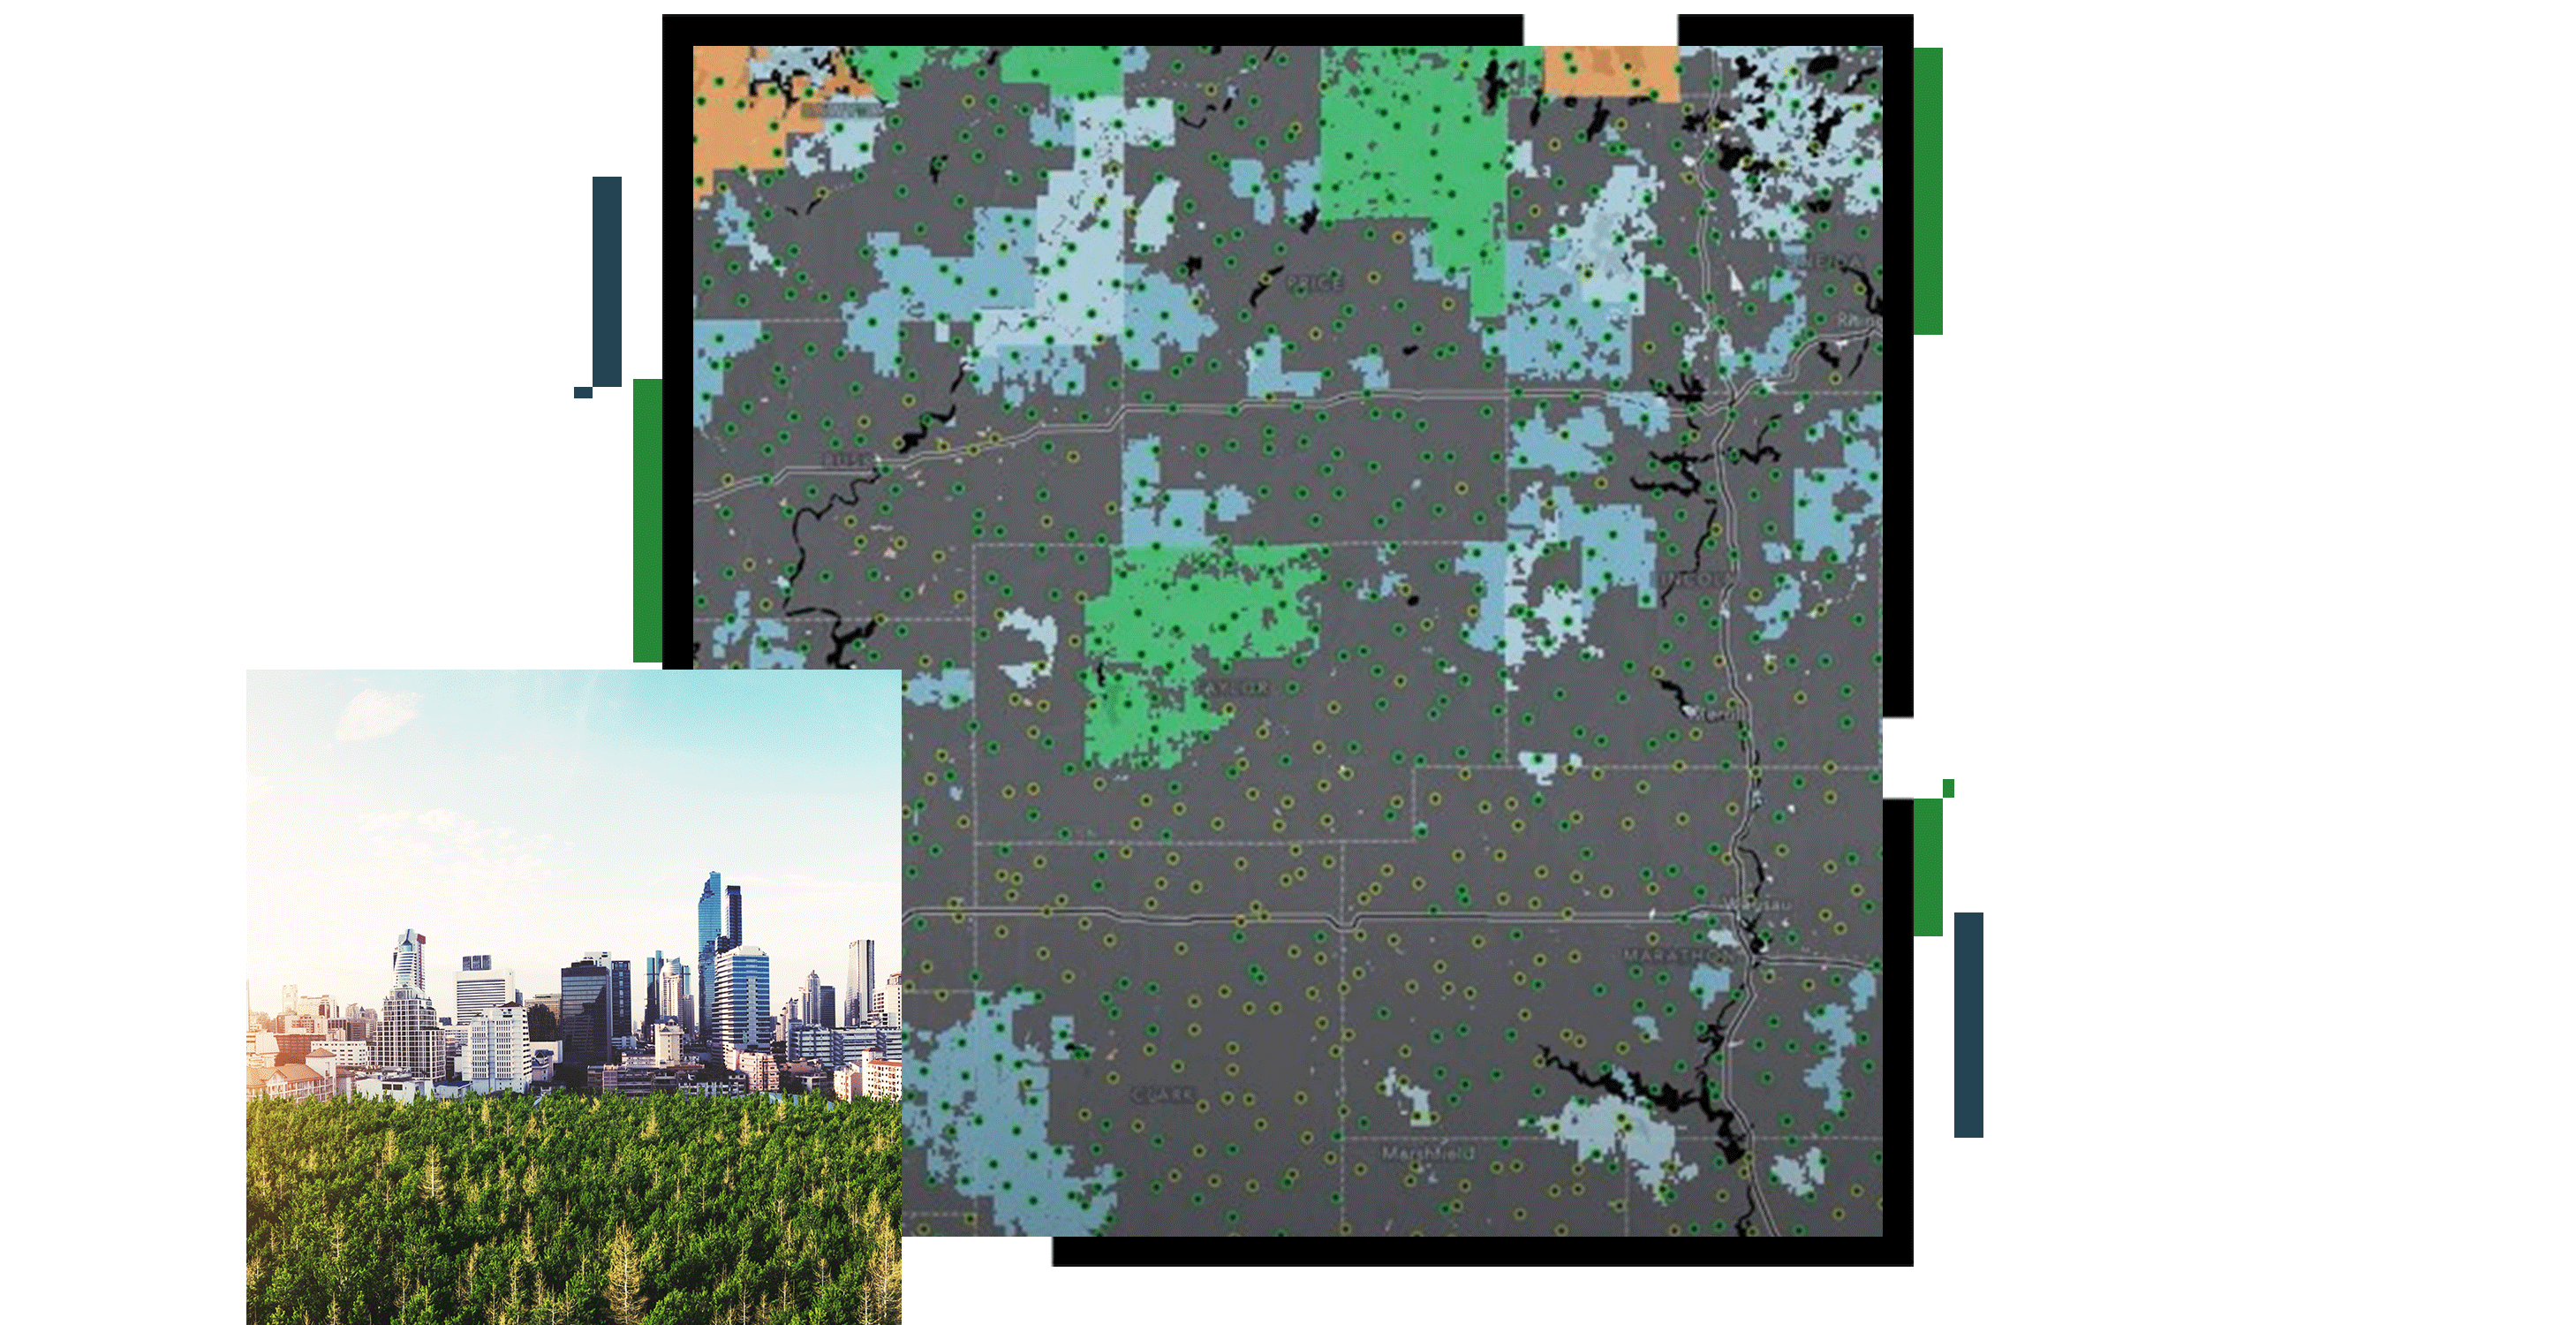
A gray and blue map with sections colored in green with small yellow points, overlaid with a photo of a landscape of treetops with a cityscape in the distance

Managing landscapes amid economic development

Protect the value of forest resources

As forest boundaries come under pressure from economic development, foresters need models that respect a more holistic approach to forest management, including modern sustainable silvicultural practices and safeguarding boundaries. These models can help answer pressing questions such as: In a potentially drier climate, how should plans shift for fire protection around the urban interface and forest communities? What are future wild land fire management expectations? Which investments will help fire-adapted landscapes? And how should tribal considerations influence important cultural landscapes?

Précédent
Suivant

Measure, understand, and communicate

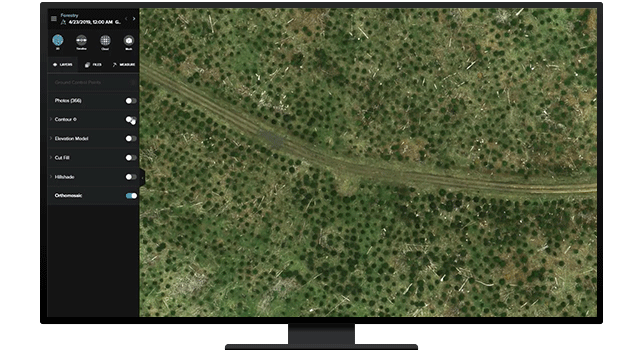
Remote sensing

Access imagery and remote sensing archives and new data feeds to monitor forest operations, activities, and every phase of the supply chain. Capture and process new imagery effectively to enable timely decision-making.

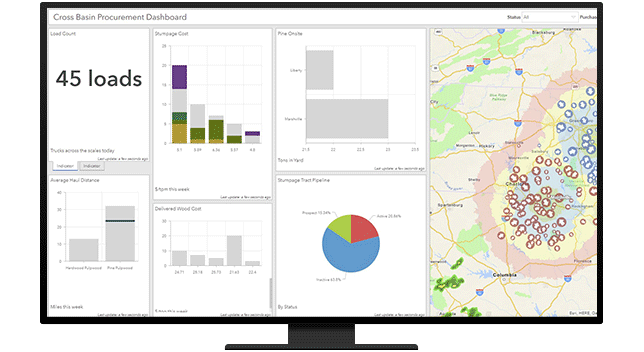
A graphic of a computer monitor displaying a map dashboard with graphs, charts, and a map

Reveal and understand patterns

Use smart maps and dashboards to discover and understand patterns of operational performance to improve forecasting, save time, and make data-driven decisions.

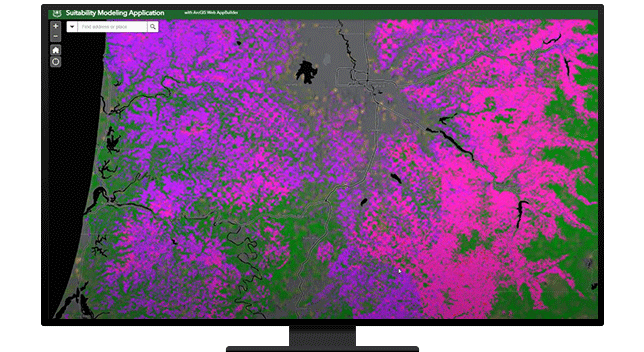
A graphic of a computer monitor displaying a heat map in bright green, pink, and purple

Assess forest health with data

Track the growth of your most important assets. Identify forest conditions to determine where appropriate treatments are needed to sustain and promote forest health. Generate models and reports to estimate volume and yield of timber harvest.

A graphic of a computer monitor displaying an aerial view of a green and brown forest with a road through the middle with an analysis legend on the side

Communicate with stakeholders

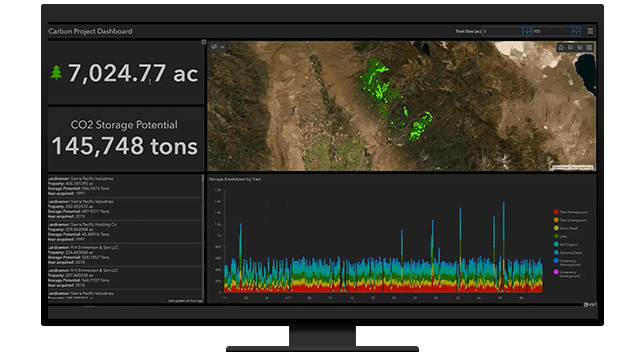
Publish location-based apps and dashboards that inform stakeholders of project progress. Dynamic maps provide a data exchange between your organization and residents. ArcGIS StoryMaps can serve to illustrate return on investment (ROI) and environmental impacts.

A graphic of a computer monitor displaying a map dashboard with data, a graph, and an aerial photo of a forest

VIDEO

USDA Forest Service: Stewarding America's forests

Inform policy and management decisions for forests with advanced remote sensing technologies in the Forest Inventory and Analysis (FIA) Program.

Products for managing forest interfaces

Précédent
Suivant

Contact sales

Connect with the Esri forestry team