
Mobile Mapping solutions in ArcGIS
This page is your source for information on how to use your mobile mapping images in your GIS solution. This page is for you if you need insight into the terrain situation.
View, measure, make an inventory and check.

Alternative to the disappearance of the mobile mapping application from the Flemish government.
Since many customers use images in their GIS solution, Esri BeLux has looked into whether one (or more) solution (s) can be offered to its current and future customers. For example, in consultation with Cyclomedia, it has been examined whether a solution could be offered in the short term (and of course also in the long term) based on their images. The combination of the Cyclomedia images with the strength of ArcGIS offers a powerful tool to working efficiently and cost-effectively.
With the Street Smart Widget for ArcGIS you can add Cycloramas to your own app in ArcGIS Online or Portal for ArcGIS. As a user of the Web AppBuilder Developer Edition you can add the Widget to your own app and publish it in your portal or at CycloMedia. There is also an add-in that offers the possibility to use Cycloramas within ArcGIS Pro.
CycloMedia is market and technology leader in large-scale systematic visualization of environments, creating 360° panoramic street-level images from public roads (GeoCycloramas). The in-house developed and patented technology allows the accurately positioned panoramic imagery to be produced on a nationwide scale in a highly automated production and quality control process.
The previous solution from CycloMedia was called GlobeTrotter which is so outdated that support is no longer offered for it. The footage at our disposal also dates from 2013 and is therefore a previous generation camera that does not support the LiDAR point cloud. The lastest version of the plugin is now called Street Smart.
CycloMedia uses a unique, patented recording system that creates highly-accurate, parallax-free 360° spherical images. Lidar is captured and processed with the imagery to create 3D GeoCycloramas which provide quick and easy measuring as well as flood visualizations. CycloMedia vehicles capture GeoCycloramas every 5 meters, which allows you to view buildings, objects, public green space and roads from various angles. GeoCycloramas enable precision measurements for asset inventories and convenient field checking for condition assessments from the office, saving time and increasing safely.
ArcGIS Pro add-in is available on the ESRI Marketplace
The Street Smart Add-In for ArcGIS Pro brings high resolution street-level imagery to your desktop in a 3D environment for measuring and collecting data.
The Street Smart Add-In for ArcGIS Pro lets you:
• View both current and historical GeoCycloramas
• View detailed GeoCyclorama image information
• Display feature layers as overlays on GeoCycloramas
• Save point, line, and polygon measurements made on GeoCycloramas into feature classes
• Save a snapshot of the current view in PNG format
• Shade imagery by elevation to visualize flooding and water drainage
DOCUMENTATION: User manual Street Smart for ArcGIS Pro
Street Smart Web AppBuilder Widget is available on the ESRI Marketplace
The Street Smart Widget for ArcGIS introduces high resolution street-level imagery to Web Apps that you build with the Web AppBuilder. The widget works with the Web AppBuilder Developer edition 2.0 and up, or, if your organization uses ArcGIS Enterprise, you can use the widget with Web AppBuilder integrated into Portal for ArcGIS.
With the Street Smart Widget integrated into your Web App, CycloMedia’s imagery and many features of Street Smart become available:
• View both current and historical GeoCycloramas
• View detailed GeoCyclorama image information
• Display various overlays on top of GeoCycloramas, including user-defined overlays
• Perform different types of measurements in GeoCycloramas, such as point, distance, surface and height measurements
• Export your view to PNG images
DOCUMENTATION: Installation manual
DOCUMENTATION: User manual for Street Smart widget for ArcGIS
There is a demoaccount available that can be used which contains data for Roeselare including new images and LiDAR pointcloud. In addition there is also a nice example on City of Schiedam (using ArcGIS)
This combination offers various options:
• pure visualization
• check data
• integration in a web application
• inventory based on visual material.
Esri offers you a short-term solution:
• use of the former Cyclomedia images for a period of 6 months *, that way you can refine your strategy.
• indicative price: € 3.5 / km (municipality territory)
• use of the widget in ArcGIS: included and an unlimited number of users of the Cyclomedia data and widgets within the municipality entity.
If you are interested please confirm your interest via our contactpage.
* This is about images recorded by Cyclomedia. The date of life of the images depends on your territory and the date of recording.
What can you achieve with the Street Smart Widget in “Web AppBuilder for Developers”.
Click here for the installation instructions.
Here is how you can download the Street Smart Widget from the “ArcGis market place” the “Street Smart Widget”.
Below we give an overview of what you can achieve with the Cyclomedia images on the basis of a number of screenshots:

The images from Cyclomedia are of very high quality (they combine the quality of the Cyclorama images with the accuracy of the lidar data). These images can therefore certainly be used for professional purposes.
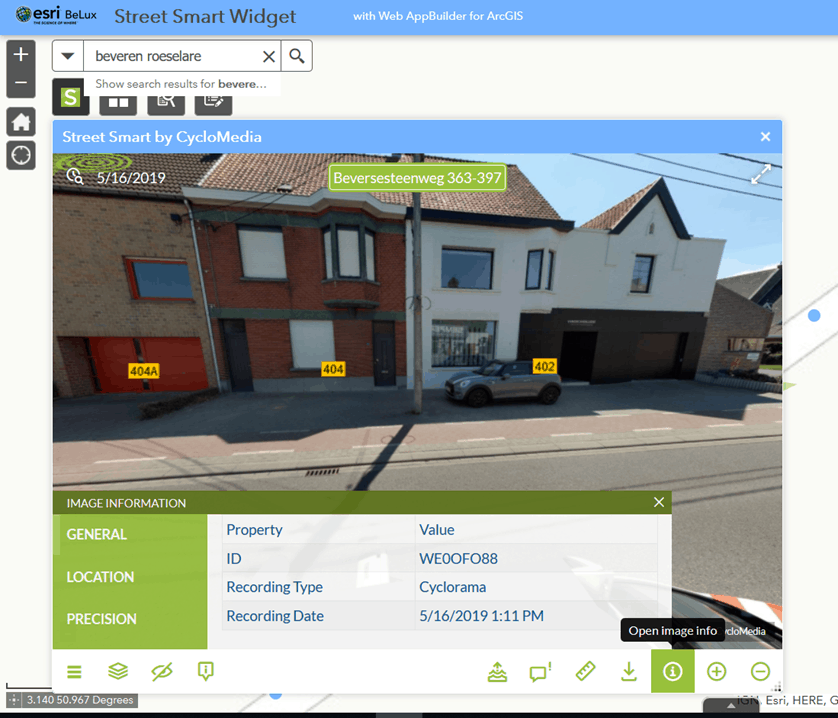
Each image also contains metadata that you can use in your files, images and metadata can be exported as PNG in your documents.
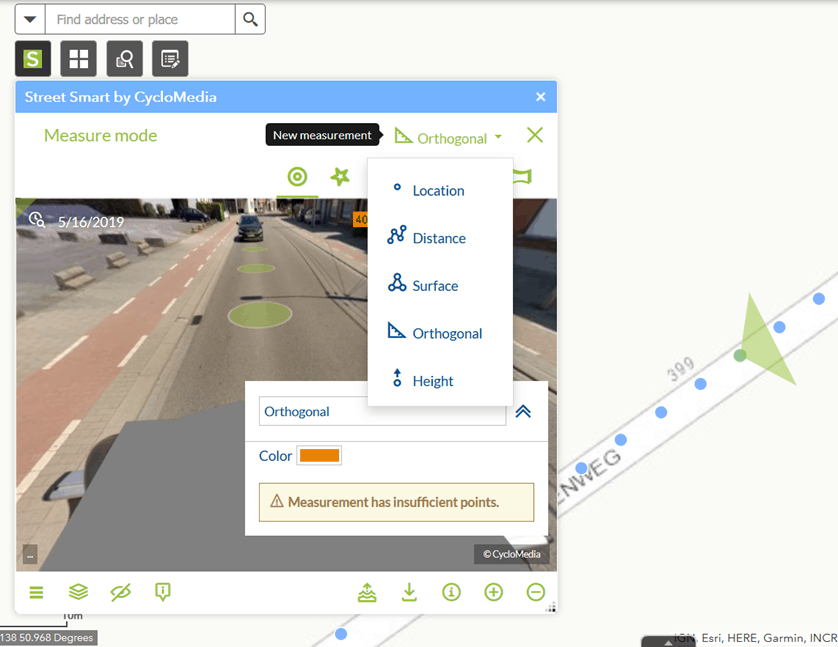
The “measure mode” allows you to measure matters remotely and there are also several measurement options available: Location (X, Y), distance, area, perpendicular lines and height, with many possible applications.
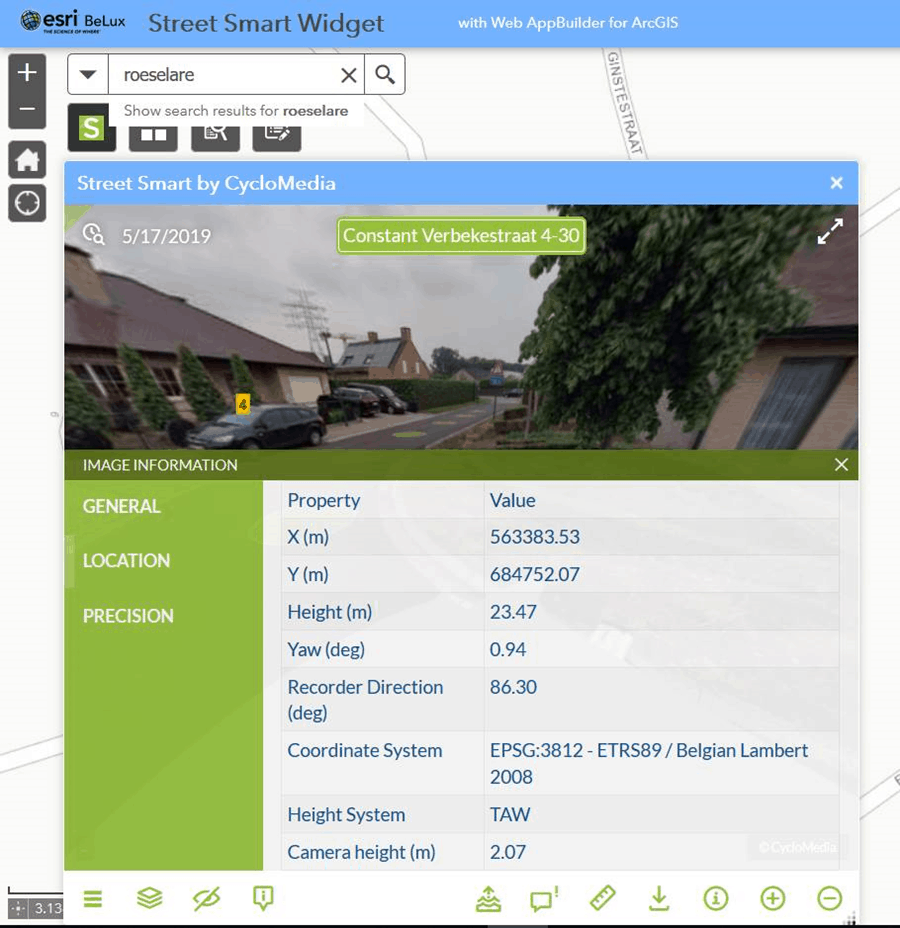
In the measuring mode you can also measure very accurately based on the coordinates of each point.

Naturally, the measurement mode also allows you to measure the distances between a number of points.
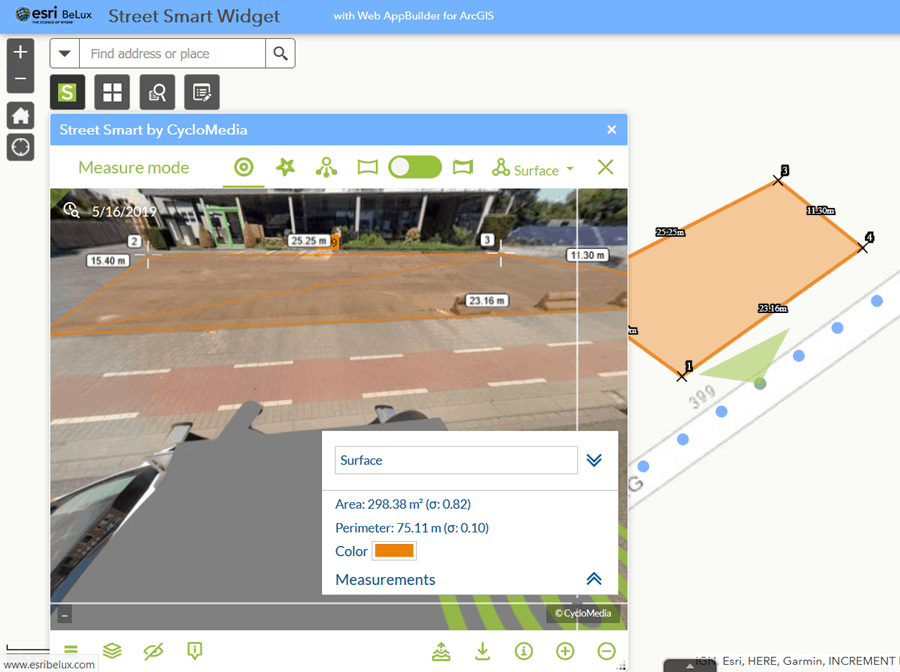
With the Street Smart widget you can also see the dimensions in the units that you have chosen in the spatial reference system (SRS) when setting up the widget. This is also possible for perpendicular lines and to measure heights.

Are you convinced or have any questions: you can always contact us via our contact form.
ImageV through Orbit GT
360° Image Database of Flanders
From 2014 to 2016, 360 ° images and a 3D point cloud of all Flemish roads were collected by IMAGE-V on behalf of Informatie Vlaanderen. These data and updates have been made available by IMAGE-V since 1 July 2019 via a new online viewer (3DMapping.Cloud).


3D Mapping Cloud – Orbit GT
When this web application is published, the user can select the widget button at any time within the user interface to call up Google StreetView. This will first automatically switch to a Google background map and make StreetView visible at the bottom of the screen.
The online viewer can be used for:
• Visualization of 360 ° images and / or 3D point clouds of the public space
• Performing measurements: points, lines, planes and volumes
• Mapping and exporting GIS files
In addition to the viewer, users get free access to the Orbit GT Plugins. Plugins for ArcGIS Pro, ArcMap, ArcOnline Widget, QGIS and AutoCAD MAP are already available today. This allows the user to access the data in his own GIS or CAD environment. Furthermore, the Viewer SDK can also be used free of charge for in-house development of plugins.
All plugins can be downloaded for free via https://orbitgt.com/products/3dm-plugins/
For this you first come to the following page where you can create an OrbitGT account for free:
More info about the ESRI plugins:
• ArcGIS Pro Plugin
• ArcOnline Widget
For an overview of the pricing of the 3DMapping.Cloud you can visit the website

Demo Publication
For demos you can use our demo publication without login and password:
URL demo publication: LINK TO DEMO
Token (for use in plugins) GVlsJRIwITPbni1E54u3
Managing and Visualizing Oriented Imagery
It’s generally accepted that imagery taken looking straight down at the ground, like traditional satellite imagery, can be visualized on a map and incorporated into your GIS. Other imagery, however, is more difficult to visualize and incorporate into your GIS. Such non-nadir, “oriented imagery” includes oblique, bubble, 360-degree, street-side, and inspection imagery, among others.
Oriented Imagery from Esri solves that problem, providing a solution for managing, visualizing, and exploring imagery that’s taken from any angle.
Collections of oriented images can be accessed and explored in two ways: using either the Oriented Imagery add-in for ArcGIS Pro, or a web app that includes the Oriented Imagery widget. In both the ArcGIS Pro add-in and widget, users select an oriented imagery catalog (OIC), click a location of interest on the map, then explore any available oriented images that depict the selected point in the inset viewer. As you pan and zoom in the oriented image, see the camera’s field of view dynamically updated on the map. The viewer also includes:
- Spatial navigation tools designed to work with oriented imagery
- Querying based on current view and filters (including time)
- Image enhancement options
- Linear and height measurement tools (when the imagery supports it)
- Synchronized display of view extent
- Option to display extents and images similar to your current selection
Collections of oriented imagery are managed using oriented imagery catalogs (OICs). An OIC is a data structure that references a point-based feature service that defines the camera location, orientation, and image metadata.
To visualize and explore your own oriented imagery collection, you’ll need to create your own OIC. To do this, you’ll use a set of Oriented Imagery Management geoprocessing tools available from ArcGIS Online. (Note that the imagery must be web accessible, so imagery is usually stored in cloud storage.) The process for creating an OIC is as follows:
1. Store imagery in cloud storage.
2. Use ArcGIS Pro to:
a) Create an empty OIC.
b) Add imagery to the OIC.
c) Create coverage features and a coverage map.
d) Publish the OIC and coverage map to ArcGIS Online.
3. From ArcGIS Online, add the OIC to ArcGIS Pro or an Oriented Imagery app.
Finally, for users who want to create a custom Oriented Imagery app to share their imagery, the Oriented Imagery widget (designed to work with Web AppBuilder for ArcGIS) is available from GitHub. For more advanced developers, there is also an Oriented Imagery API and a detailed description of the OIC schema to help create and customize applications.
Explore the following resources to learn more about managing and visualizing oriented imagery. (Not sure where to start? Look for the star by Esri’s most helpful resources.)

Community-supported tools and best practices for working with imagery and automating workflows:
Try this example Oriented Imagery app to see how Oriented Imagery works for yourself.*
To view oriented imagery catalogs (OICs) in ArcGIS Pro, download the Oriented Imagery add-in for ArcGIS Pro for free from the ArcGIS Marketplace. This will allow you to visualize and explore oriented imagery in the context of a map.*
To create and manage your own OICs, download the Oriented Imagery Management Tools from ArcGIS Online. This is a prerequisite for visualizing your own oriented imagery in ArcGIS.
Follow the Creating an Oriented Imagery Catalog tutorial to get hands-on experience creating your own OICs to manage oriented imagery.
Resources and support for automating and customizing workflows:
- Visit the Oriented Imagery GitHub repo to download the Oriented Imagery widget for Web AppBuilder for ArcGIS (Developer Edition). Use it to build an app for visualizing oriented imagery (like this example app), no coding required.
- Read a detailed schema for oriented imagery catalogs.
Online places for the Esri community to connect, collaborate, and share experiences:

Drivenby – imajbox
DrivenBy is a Belgian company offering to professionals the opportunity to access innovative technologies to gather, process and disseminate geoinformation. Based on a rich experience of 20 years in mobile mapping and a strong network of specialized partners, our products and services use imajbox® technology. We focus on the frequent update of the information, its near real-time transmission and a perfect match to the real needs of the users in terms quality, accuracy and price.
You need a solution to survey, view and inspect road networks, cycling paths, navigable rivers or railways ? You want to share this information inside your organization and use it to enrich your geoinformation layers ?
Then, you’ll be « DrivenBy Mobile Mapping » !

DrivenBy is the official reseller of imajbox® solution for Belgium and Luxembourg. It includes imajbox® the portable mobile mapping survey sensor, imajview® desktop processing software and the web service imajnet® for ArcGIS OnLine.
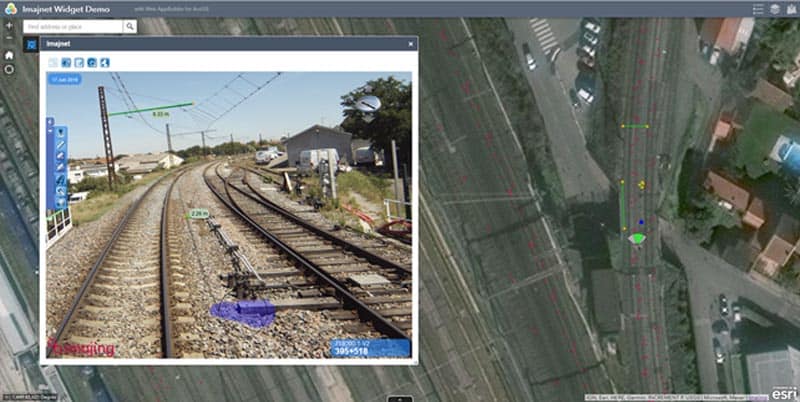
imajnet® is a complete web service to access imagery of streets, transportation networks and linear infrastructures. Images are accurately georeferenced and oriented to map in 3D, measure and qualify all visible assets.
Thanks to the specific widget for Web App builder, imajnet® service is ready to be integrated in any application built with Web App Builder inside ArcGIS OnLine environment.


imajnet® functionnalities are :
- View and zoom in images
- Navigate through the surveyed network
- Use the map interface or a linear reference system to select the image needed
- Create 3D points, polylines and polygons directly inside GIS layers
- Project GIS layers inside images to view enriched environment or update existing data
Imagery published on imajnet® is used to map or measure objects in 3D using either stereophotogrammetric tools or 3D points clouds generated automatically with the same images.
imajnet® widget for Web App builder can be integrated inside your applications to produce, control, edit and view your data in ESRI environment using large volume of imagery.
Find more about imajnet® web service at www.drivenby.be and www.imajnet.net