The FANC’s mission is to protect the public, workers, and the environment from the risks of ionizing radiation. Their activities range from monitoring nuclear power plants to verifying medical facilities, as well as the continuous monitoring of radioactivity across Belgium through the TELERAD network. In all of this, GIS plays a major role.
“It is essential that we have advanced GIS tools to perform accurate measurements and map them. They also need to be flexible enough so that we can adjust them internally,” says Mélanie Boulanger, spokesperson for the Federal Agency for Nuclear Control (FANC).

Transparent Communication
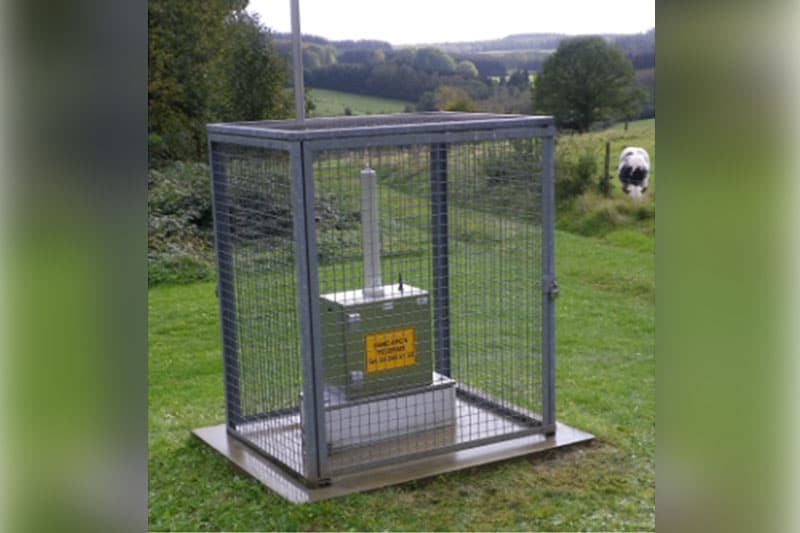
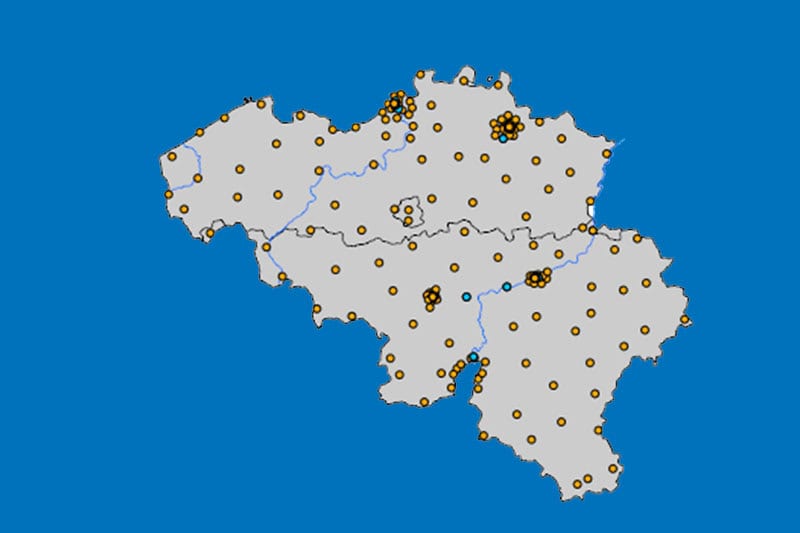
François Menneson, head of the TELERAD network at FANC, explains how they use Esri’s tools: “On the map of Belgium available on the telerad.be website, you can see the location of our approximately 300 beacons that measure environmental radioactivity. By clicking on a beacon, you can access information about it and the latest measurements it has performed. You can also overlay a map of radon concentrations.
Accurate Data
Initially, TELERAD used the ArcGIS Desktop solution to create static maps. “To share data with the public, increase transparency, and create a website, we chose a flexible, global solution: ArcGIS Online,” explains Thibault Vanaudenhove, coordinator of nuclear emergency planning at FANC.
FANC also collects various samples (cow’s milk, shellfish, grass, water, etc.). These are sent to the laboratory, where radioactivity concentrations can be measured much more accurately. Menneson notes: “Currently, the results of these measurements are published in a PDF report. In the future, we aim to improve the readability of these results by displaying the data on a map through a public web interface. We will definitely use a GIS tool for this.”

Immediate and Efficient Exchange
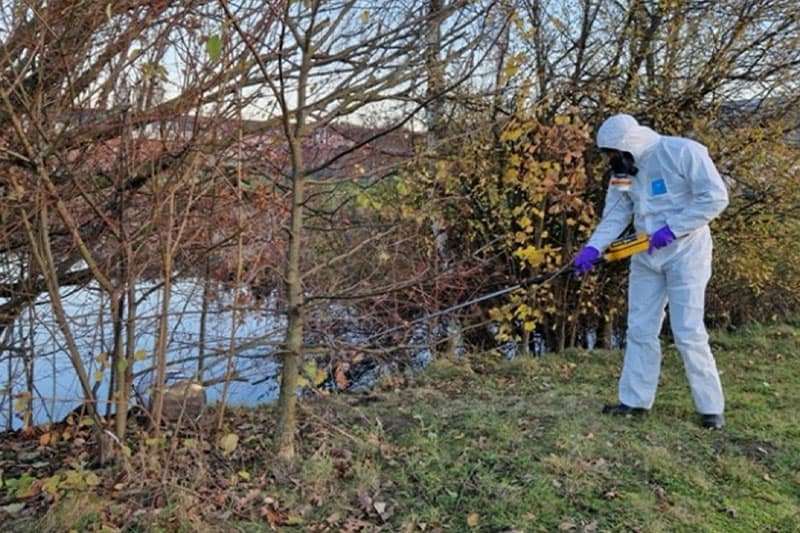
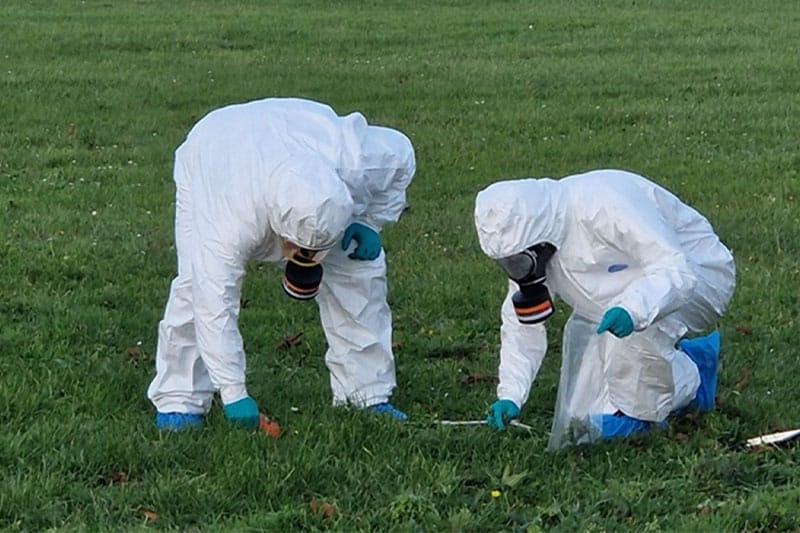
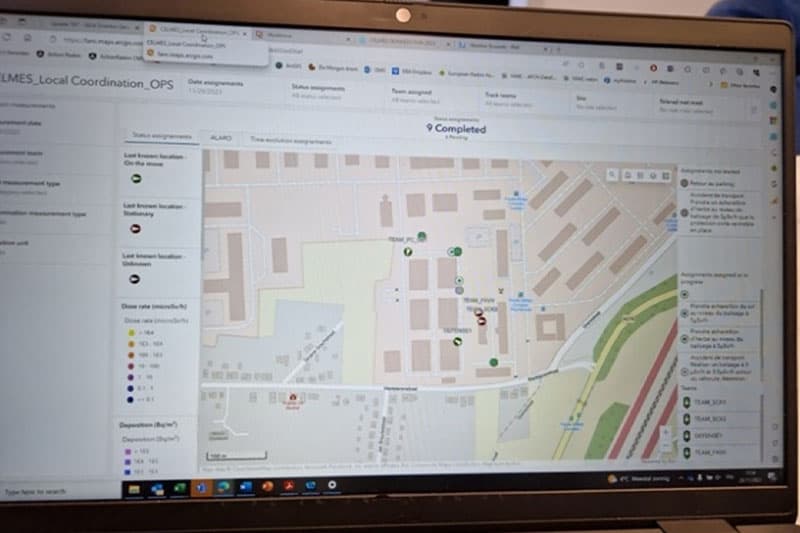
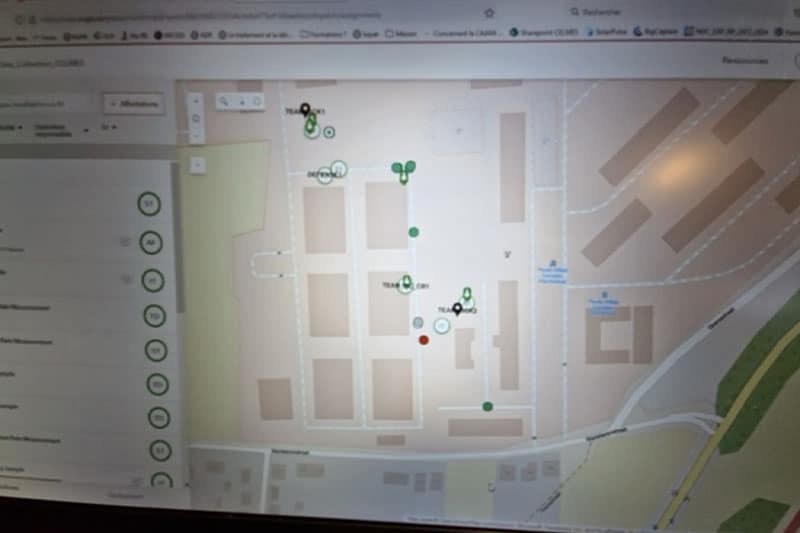
FANC is also responsible for creating an emergency plan. The purpose? To coordinate actions in case of a nuclear or radiological emergency threatening Belgium. Vanaudenhove explains: “The crisis center coordinator must manage the teams on the ground remotely, communicate with them, and track their positions and movements on a map. The teams, in turn, must be able to send their measurement data, observations, and photos in real time. For this, we use various Esri applications (Survey123, Workforce, Field Maps, Dashboards, and Data Pipelines), which allow us to transmit and exchange information quickly and efficiently.”
Flexible Tools
Both François Menneson and Thibault Vanaudenhove highlight the advantages of these applications: for example, the Survey123 forms are multilingual. They are sent in the language set on the user’s smartphone, which makes data transfer much smoother. They particularly emphasize the flexibility of Esri’s tools: “We were looking for a more flexible solution, and we found it in the tools we now use. We can adjust them to our needs, add extra layers, and decide which layers to display, for example, in the dashboards.” They also appreciate that these tools are cloud-based: “No internal management, no access requests, it’s much easier to handle.”
Promising Possibilities
The two engineers are very pleased with their collaboration with Esri BeLux: “Although we continue to strengthen our GIS skills and knowledge, especially through the training and webinars provided by our partner, we rely on them for certain developments. For example, we are working with Data Pipelines to simulate increased radiation levels for our crisis exercises. We are constantly striving to improve our tools, and this collaboration makes that possible.”

