Discover the GIS possibilities
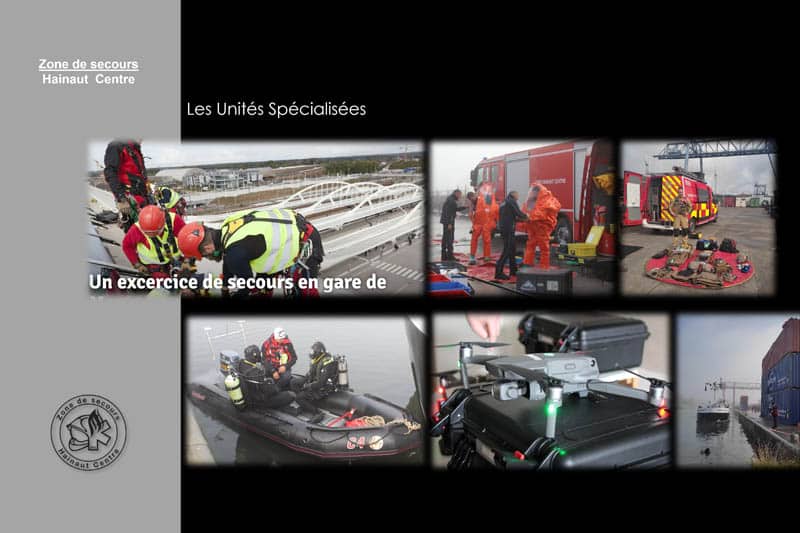
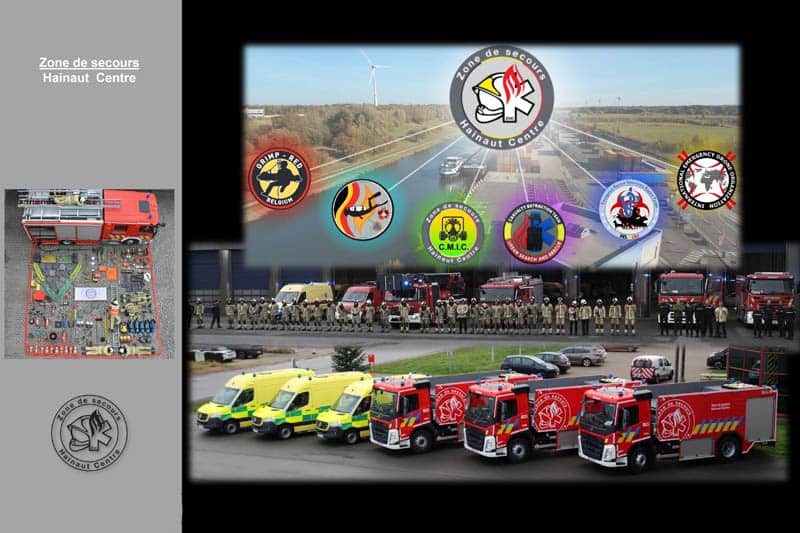
The Hainaut Centre Emergency Response Zone is a supra-municipal structure covering 28 highly populated municipalities – with a total of about 550,000 inhabitants. Their missions? Firefighting operations and urgent medical aid, as well as fire prevention. The GIS solutions, implemented thanks to Esri’s products, are essential for successfully accomplishing these, as explained by Major Bruno Vercaemer and Captain Olivier Cogels.
Decisive Analyses
“To decide on the necessary resources to meet the risks, their analysis is crucial. It allows us to develop an operational coverage plan, in terms of the number and geographical distribution of rescue stations, human and material resources,” explains Bruno Vercaemer, deputy director of operations – specifically responsible for emergency planning and the drafting of plans that require the use of cartography.
This analysis includes two parts:
- The first is an inventory of traffic networks, industrial and sensitive sites, high-risk healthcare facilities, tall buildings, tourist establishments, and events that attract large numbers of people, such as carnivals, the Ducasse of Mons, or the festivals of Dour and Ronquières.
- The second part concerns the analysis of intervention statistics.
“ArcGIS PRO is what we used to perform this risk analysis as well as the positioning of the fire stations,” says Olivier Cogels, responsible for GIS management and cartography. “For the latter, the Network Analyst tool allowed us to calculate isochrones. We then created StoryMaps to present the results of our analysis to the 28 mayors of the zone.”

Optimal Information Sharing

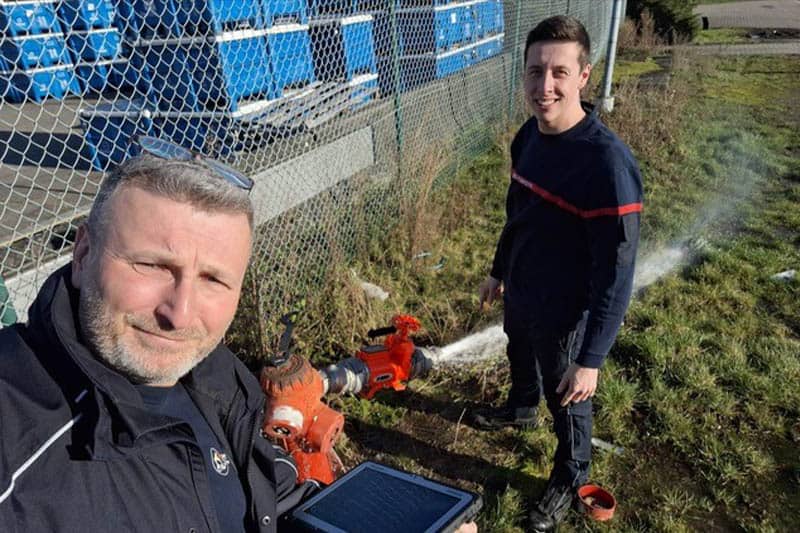
Another essential advantage that the Hainaut Centre Zone currently has is its centralized information collection and sharing system. To feed it, the HCZ mainly uses the GIS-OPS application (which it developed with the ArcGIS WebApp Builder tool), a web app itself fed by data collected via ArcGIS Survey 123 forms. This data includes, for example, water resources, crucial information to know during chemical interventions, information related to traffic info or necessary for emergency planning. This cartography is particularly used for the drafting of prevention files, and allows dispatching to have valuable information it can communicate to those on the ground during an intervention.
Captain Cogels also emphasizes the creation of the cartographic portal using ArcGIS Experience Builder, as well as Dashboards: “These somewhat summarize the interventions that have taken place since 2023. They are very useful in case of bad weather: it is possible to filter by date and see, for a given period, the number and type of operations carried out.”
Effective Products and Support
The main advantages of Esri solutions? Olivier Cogels lists several, starting with their ease of use for the user, both in consultation and modification. “These products are also easy to configure, they are very well documented, compatible with many other software (such as Microsoft Power Automate for example) and cause very few bugs. And when we encounter a problem, we call Esri’s support who always finds a solution to solve it or work around it.”
To conclude, Captain Cogels emphasizes the satisfaction of the software’s end-users: “It was not imposed on them; on the contrary, it meets their expectations. Thanks to its flexibility, it adapts to the demand and not the other way around. Moreover, automation has significantly reduced the number of operations to be carried out, which means saving a lot of time.”


