Part of the Esri Geospatial Cloud, ArcGIS Pro is Esri’s powerful, single desktop GIS application. Technologically ahead of everything else on the market, ArcGIS Pro supports data visualization, advanced analysis and authoritative data maintenance in both 2D and 3D. ArcGIS Pro is tightly coupled with the ArcGIS platform supporting data sharing across ArcGIS Online and ArcGIS Enterprise through Web GIS.
Thanks to our intern Hao we can present this storymap that explores the theme of noise propagation in the European quarter in Brussels using open data. The idea is to show that 3D is not just used to make things “pretty” but also for analysis. The GIS 3D analysis was done in ArcGIS Pro, however the results were then shared using web scenes and 3D web applications in order to integrate them into a complete report in a storymap.
Are you affected by Noise?
The project of Hao starts with the descision of the European Commission for the construction of two towers at 130 rue de la Loi, Schuman Brussels. These towers will become the tallest buildings in Brussels.
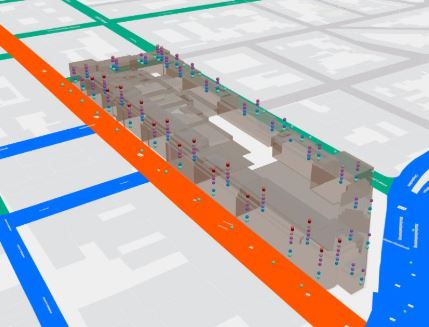
We wanted to look into the impact of noise in these buildings. What could be the noise level in each floor of the buildings and how will the results differ from a 2D appoach.
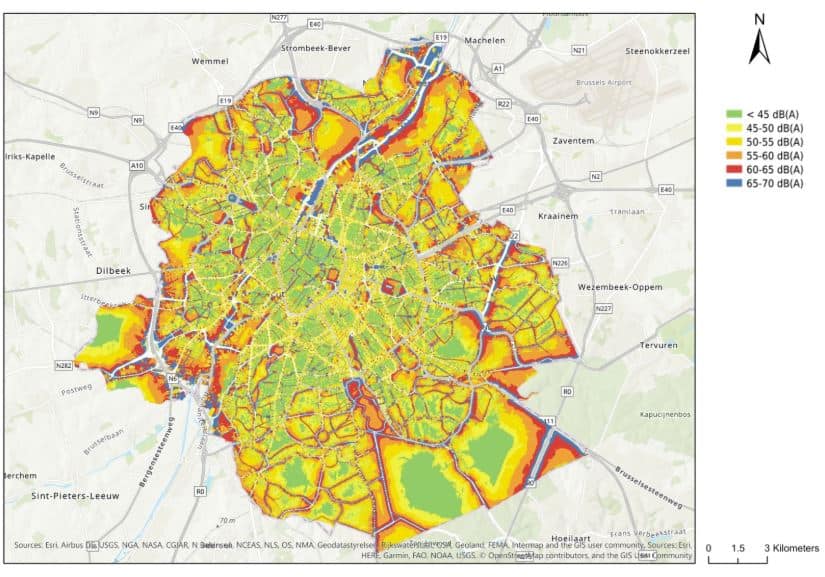
Although these maps provide detailed overviews of noise distribution around the city, they can only show what happens on a 2D surface. While the truth is that noise is distributed differently in space. It is also affected by many kinds of factors (air temperature, humidity, building absorption, spreading distance, etc.). So, what could be the real distribution of noise in our city? That’s how 3D studies can help.
This project aims at building a 3D noise map for a block around Schuman (Brussels), which will be constructed as a new EU site by 2025. Currently, there are mainly office buildings with an average height around 25 meters. Around the site there are three different type of roads: metropolitan road, trans-district road and neighborhood roads.
Hao used ArcGIS Pro to make the 3D analysis.

Find anwers in your data

ArcGIS Pro lets you mash up multiple data sources to make maps that are as smart as they are beautiful. Use powerful 2D and 3D analytical tools to identify patterns and trends. Then put this information to good use by sharing it within your organization, online, and through mobile apps.
Thanks to the possibility of ArcGIS Pro that supports industry and community standards to ensure inclusion of any dataset you have, Hao could use Open Data Sources from Urbis, Brussels Environment Services and the World Traffic Service Basemap from Esri
Show the results
Hao used ArcGIS Storymap to tell more about his project. Discover this here.

